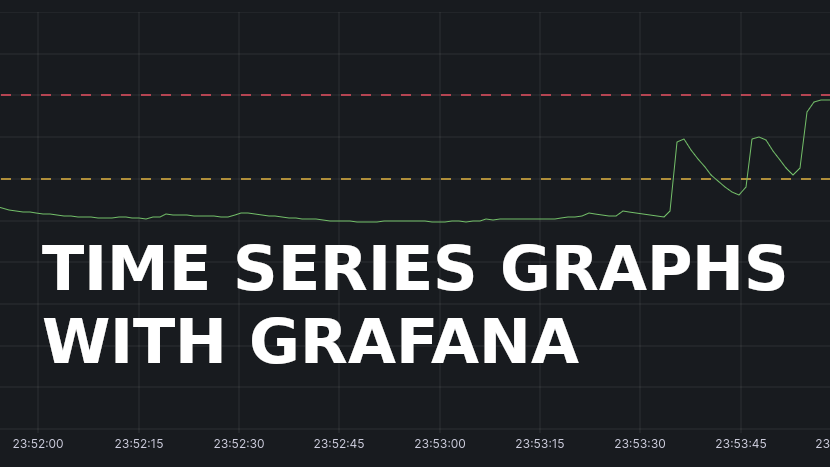
Visualising Data with Grafana Loki From Scratch
In this post we're going to have a look at how to set up a local grafana loki installation via docker-compose and generating some test data for our fresh installation via a log transport.
Prerequisites:
- docker
- docker-compose
- node.js
Grafana is a great tool for capturing and searching logs and it can be a bit of an overwhelming system to break into. There is also a new query language to learn if you want to query logs in grafana, called logql, which we'll be using in a bit. Grafana also has a lot of components that do different things or serve different purposes. We're interested in capturing logs and visualising them for this tutorial.
Let's create a directory like grafana-playground and start producing some logs!
Producing Logs for Grafana
Logging often happens straight to stdout, which is the terminal output of the shell running your application. You can pick up these logs with promtail and send them to Grafana. However, you can also log straight from your application and send them to Grafana and many logging libraries will provide you with features to send your logs to grafana instead of the standard out. One of these libraries is winston and the relevant transport for winston-loki.
Let's go ahead and create a new directory called log-producer to emit some logs:
mkdir log-producer
cd log-producer
npm init -y
npm install winston winston-loki
touch log-test.js
Then we can run this file from the official examples of winston-loki:
// log-test.js
const winston = require('winston')
const LokiTransport = require('winston-loki');
const logger = winston.createLogger()

logger.add(new winston.transports.Console({
  format: winston.format.json(),
  level: 'debug'
}))

logger.add(new LokiTransport({
  host: 'http://127.0.0.1:3100',
  json: true,
  labels: { job: 'winston-loki-example' }
}))

const wait = (duration) => new Promise(resolve => {
  setTimeout(resolve, duration)
})

const run = async () => {
  while (true) {
    logger.debug('I am a debug log')
    logger.info('This is a test, no need to panic')
    logger.error('Testing for errors')
    await wait(1000)
  }
}

run()
and it will output something like this:
{"level":"debug","message":"I am a debug log"}
{"level":"info","message":"This is a test, no need to panic"}
{"level":"error","message":"Testing for errors"}
which is cool, but when we close the terminal, these log messages will disappear into the void, so let's go ahead and start a local grafana instance to actually keep and browse these logs.
Setting up Loki
The simplest way is to follow the official instructions for installing grafana locally with docker-compose:
wget https://raw.githubusercontent.com/grafana/loki/v2.9.1/production/docker-compose.yaml -O docker-compose.yaml
docker-compose -f docker-compose.yaml up
The command will download the up to date version of the docker-compose file and start promtail and grafana.
Having a look inside that file shows that grafana will run at port 3100 and the web interface will run at port 3000.
  image: grafana/loki:2.9.1https://github.com/sebhildebrandt/systeminformation
  ports:
    - "3100:3100"
# ...
      url: http://loki:3100
run docker-compose up and confirm that you actually get a nice splash screen of grafana at localhost:3000.
Now we can produce some logs to look at in Grafana!
Using a Grafana Transport for Winston in Node:
Let's go ahead and run the script we placed in log-producer earlier again:
node log-test.js
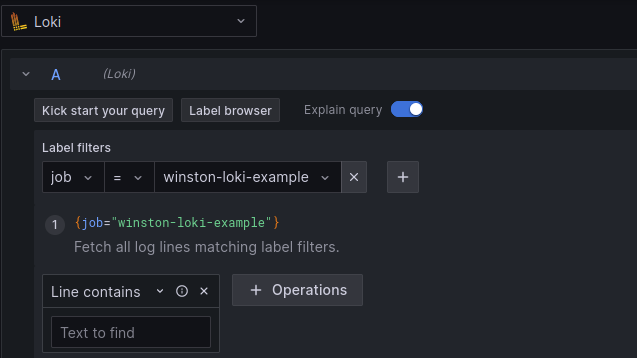
Now we can go to the Grafana web interface, find Explore in the sidebar and start querying your logs.
Select job -> winston-loki-example in the label filters and hit Run query
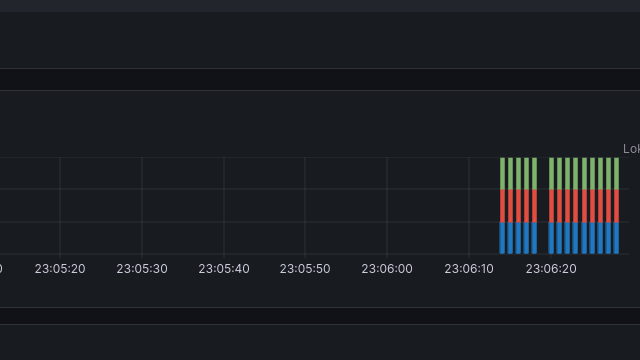
We sould be able to see a list of logs and a graph showing the split between info and error severity/level logs. If we also want to capture debug logs, we need to explicitly set the loglevel in the transport like so:
logger.add(new LokiTransport({
  host: 'http://127.0.0.1:3100',
  json: true,
+  level: 'debug',
  labels: { job: 'winston-loki-example' }
}))
Visualising your CPU temperature
For more exciting example data and a better dataset for visualisation, we can grab our CPU temperature and post the current temperature every second. After we start, we can also do something CPU intensive like transcoding video a video and observing the temperature changing.
You can use the systeminformation package or parse the output of sensors. Turns out sensors -j will give you an easily parseable JSON object of various temperature sensors on your Linux system. I had to parse the output from sensors, because the node package wasn't working for me. I'll still post logs every second and we can have a look at how we can turn the values into a timeseries graph or diagram in grafana. 🙌
My CPU temperature log producer:
// temp.js
const util = require('node:util');
const exec = util.promisify(require('node:child_process').exec);

const winston = require('winston')
const LokiTransport = require("winston-loki");


const logger = winston.createLogger()

logger.add(new winston.transports.Console({
  format: winston.format.json(),
  level: 'debug'
}))

logger.add(new LokiTransport({
  host: 'http://127.0.0.1:3100',
  labels: { job: 'cpu-temp' },
  json: true,
  format: winston.format.json(),
}))

const wait = (duration) => new Promise(resolve => {
  setTimeout(resolve, duration)
})

const cpuTemperature = async () => {
  const { stdout: sensorsOutput } = await exec('sensors -j');
  const sensorsJSON = JSON.parse(sensorsOutput);
  return sensorsJSON['k10temp-pci-00c3']['Tctl']['temp1_input'];
}

const run = async () => {
  while (true) {
    try {
      const temp = await cpuTemperature();
      logger.info({ message: 'got cpu load', temp })
    } catch (e) {
      logger.error({ message: 'could not read cpu load', e })
    }

    await wait(1000);
  }
}

run()
Now you should be able to filter after the job cpu-temp and see the logs come in.
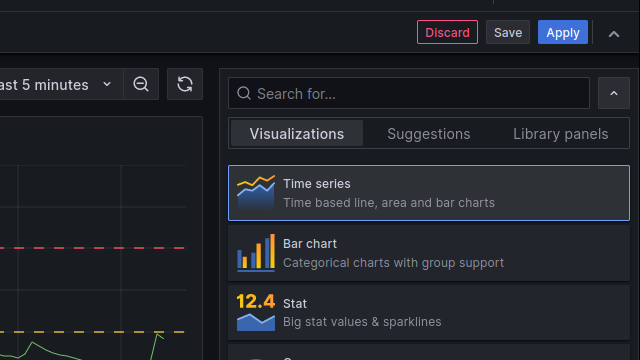
If you can see the logs after switching the job field, we can click the "add to dashboard" button in the top of the interface, edit the panel and change the type to Time series.
My query is
{job="cpu-temp"} | json | line_format `{{.temp}}`
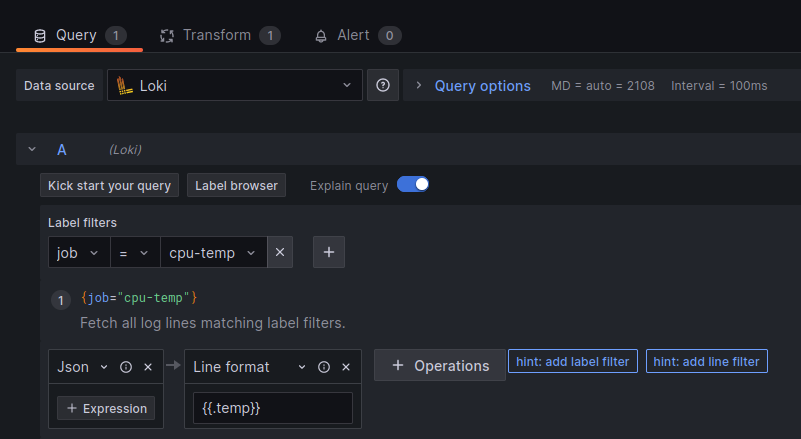
but you can also easily build it in the query builder. The important parts are:
- use the JSON formatter to let grafana use the individual fields of your JSON log messages
- specify the field that we want to plot in our timeseries graph
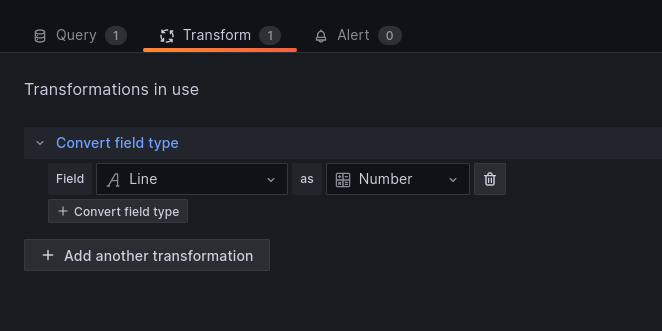
Lastly we need to add a transform to tell Grafana that our parsed JSON field is a number and not a string.
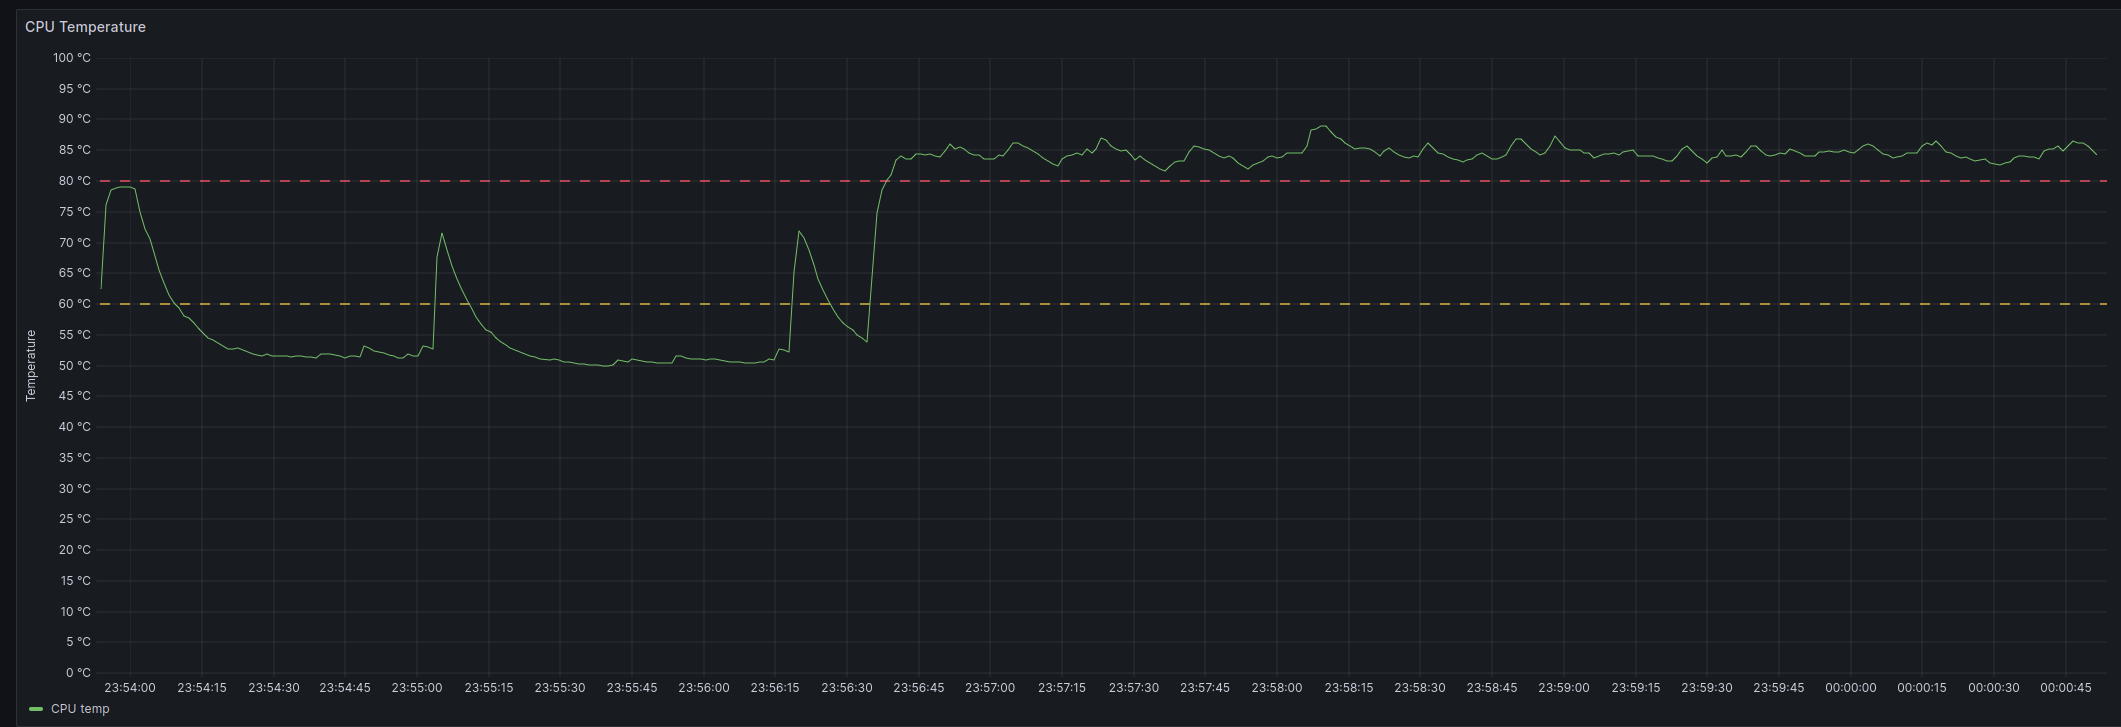
Now you should see a nice green line crawling across your graph. Let's make the data a little more exciting by doing something CPU intensive:
ffmpeg -i generic-legal-file.mp4 -c:v libvpx-vp9 -b:v 3M generic.webm
This leads me to get the nice graph right here and I can see the temperature be elevated for the duration of the video encoding:
I hope this can serve as a quick beginners guide to grafana and the basics of visualisation. There's much more to write about and how awesome distributed tracing and logging is, but practical examples that require less than 50 lines of code are usually the best intro to get everyone to start playing with a thing!