Visualising Graphs with JavaScript (d3js)
Graph visualisation in JavaScript is a lot of fun and super useful to show the connections between many items at once. There are some pretty impressive examples around the web.
Graphs can be directional to show things like "follows" in a social network or "links to" in a web crawling context.
I struggled a little bit to find an appropriate library when starting to work with graphs as I did need automatic placement of nodes and labels, but only limited interactivity based on user input.
Graph Terminology
I'm sure there are subtle differences between the terms I will use as synonyms depending on context, but they are not important to this post, so we'll just understand the following groups of words as the same thing.
In this post we're talking about both the concept and the data type: graph
The words that describe an entity like a harbour:
- point
- vertice
- node
the connection between the things, like a shipping lane:
- edge
- line
- link
Placing nodes
I knew that I did not want to place my points manually, but i needed some sort of method or module that would distribute them somewhat automatically, preferably so it would show the relationship the different points have to eachother well.
You could have a graph visualisation where not all nodes connected, some of the simpler graph libraries allows you to place your nodes with x and y coordinates.
The library and specific function I do want to feature is the d3 ForceGraph, because it positions my nodes automatically and it can colour code different groups for me.
Let's make a simple chart with no connections between the points:
<!DOCTYPE html>

<head>
	<meta charset="UTF-8">
	<script src="https://d3js.org/d3.v7.min.js"></script>
</head>

<body>
	<div id="chart"></div>

	<script>
	// your JS code will be here
	</script>
</body>
</html>
Then we, as instructed copy & paste the ForceGraph function and we can add some fake data to the nodes and render it to the page:
function ForceGraph({
	// function body from https://observablehq.com/@d3/force-directed-graph
})

const data = {
	nodes: [{
			id: 'Jonathan'
		},
		{
			id: 'Judith'
		},
		{
			id: 'Hela'
		},
		{
			id: 'Senua'
		},
	],
	links: []
}

const chart = ForceGraph(data, {
	nodeId: d => d.id,
	nodeGroup: d => d.group,
	nodeTitle: d => `${d.id}\n`,
	linkStrokeWidth: l => Math.sqrt(l.value),
	width: 700,
	height: 400,
})
document.querySelector('#chart').appendChild(chart);
When I first tried rendering the ForceGraph output without being familiar with D3, I tried this line of code to actually render the graph:
d3.select('#chart').append(chart);
and got the following error message:
DOMException: String contains an invalid character
That's because the return of the function is already a fully "functional" svg and we can append it to our DOM with
document.querySelector('#chart').appendChild(chart);
We can also create some links between the nodes, let's say we all follow Judith for some cool ancient history knowledge:
links: [
	{source: 'Hela', target: 'Jonathan'},
	{source: 'Senua', target: 'Jonathan'},
	{source: 'Jonathan', target: 'Judith'},
]
Check out the fiddle with links
Now you can see the lines between the different nodes and they will form a nice little network.
Loading JSON files
If you work with larger data sets, you will probably either get your data from an API endpoint or from a static JSON file that contains both nodes and links, you can use fetch to populate your graph visualisation as well!
I crawled some followers of our followers on Mastodon and stored the results of who follows whom in my data.json file. I can load it into d3 like this:
fetch('/data.json')
	.then((response) => response.json())
	.then((data) => {
		const chart = ForceGraph(data, {
			nodeId: d => d.id,
			nodeGroup: d => d.group,
			nodeTitle: d => `${d.id}\n`,
			linkStrokeWidth: l => Math.sqrt(l.value),
			width: 1200,
			height: 900,
		})
		document.querySelector('#chart').appendChild(chart);
	});
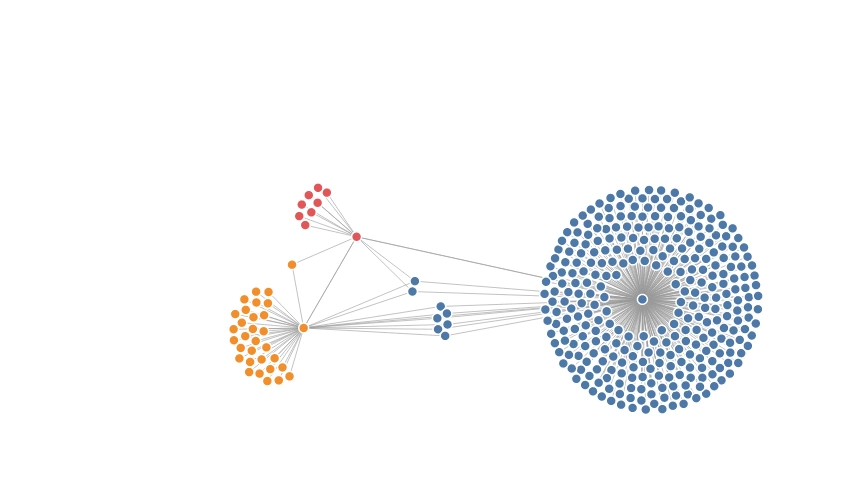
Mastodon Follower Graph Example
Which results in a really fun chart that actually shows the relationships of which account has a lot of followers, which followers are common between accounts and they are even nicely colour coded through having a "group" number (1,2,3).
On mouseover it will also show the full account URL and the nodes can still be dragged.
The accounts and their followers receive the same color, for mutuals the "first" account they were detected for counts, the nodes between the colours are shared between those accounts. The little plume around a clusters center only follow that account.
Summary
I think graph visualisation is awesome both for relationships between individuals, but also for links between sites when it comes to web crawling. I'll probably use this method or something similar to visualise on site links of a domain, representing a node size by the number of inbound links.
I still need better labels and I'm not set on using D3, but I was happy to play around with it and cover the basics!
Another fantastic graph example is sigma + graphology, if you need some inspiration!
What are you going to visualise with a graph? Let me know! \o/